See what you can do with Pivot Report
Pivot tables in a few clicks
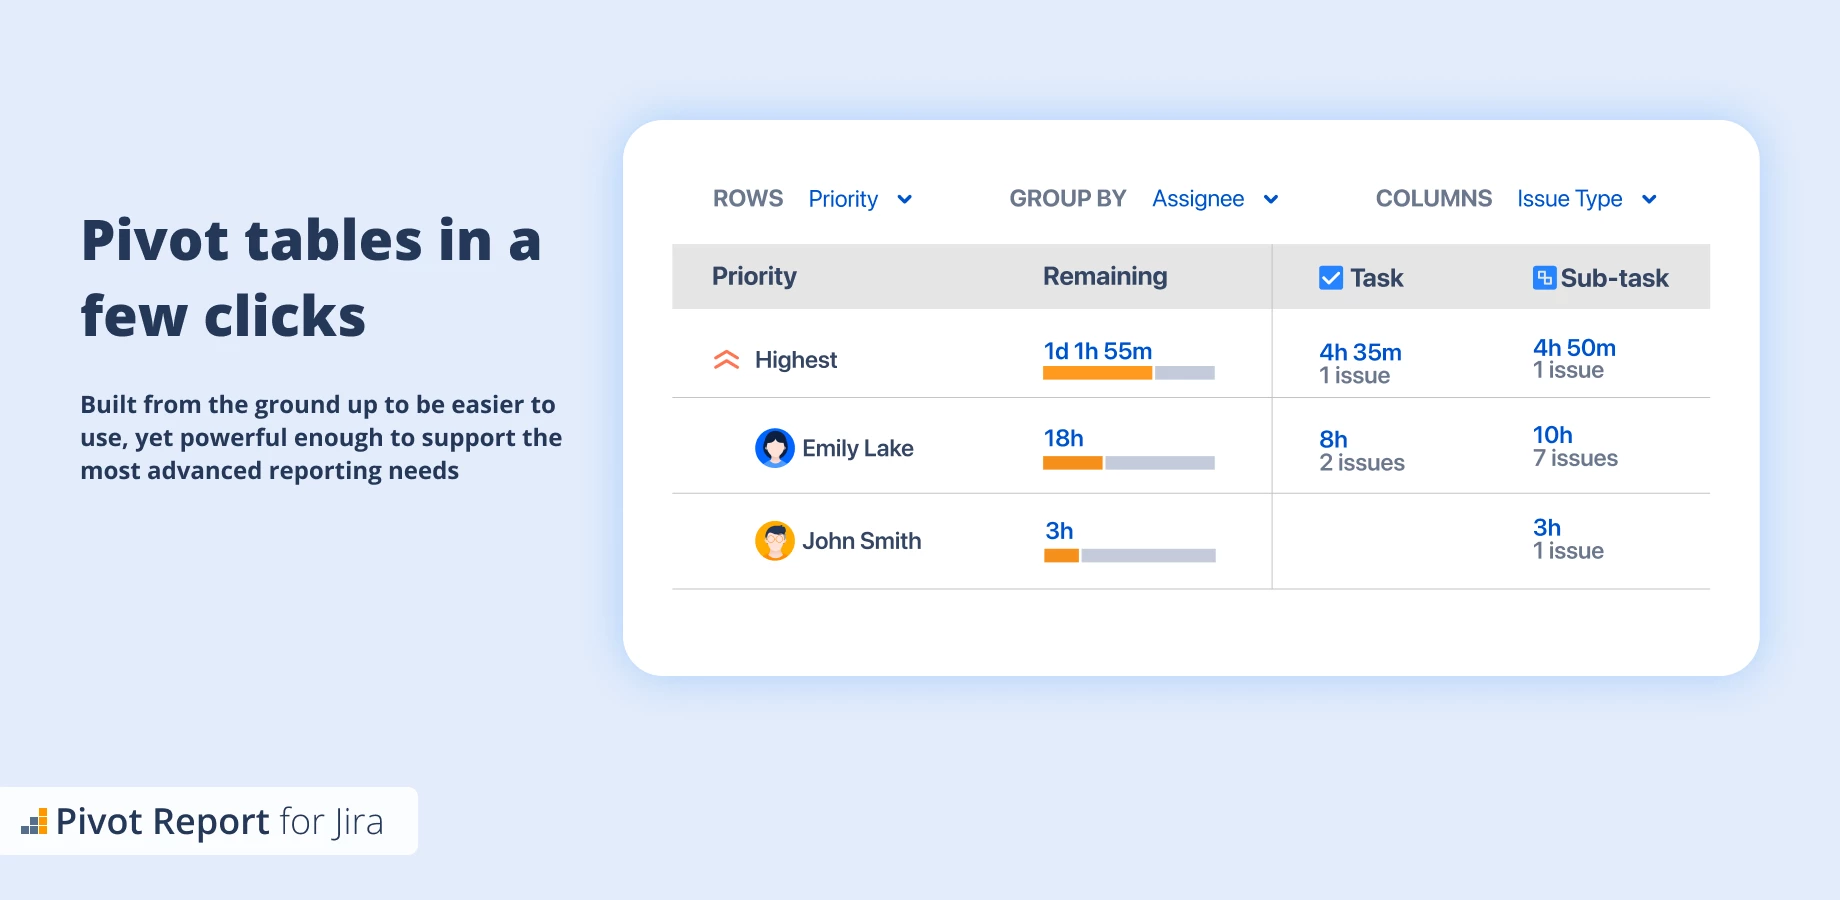
Pivot tables in a few clicks
Built from the ground up to be easier to use, yet powerful enough to support the most advanced reporting needs. You can easily represent data from issues as a pivot table with no hassle.
MULTI PROJECT REPORTProgress overview the way it should be done
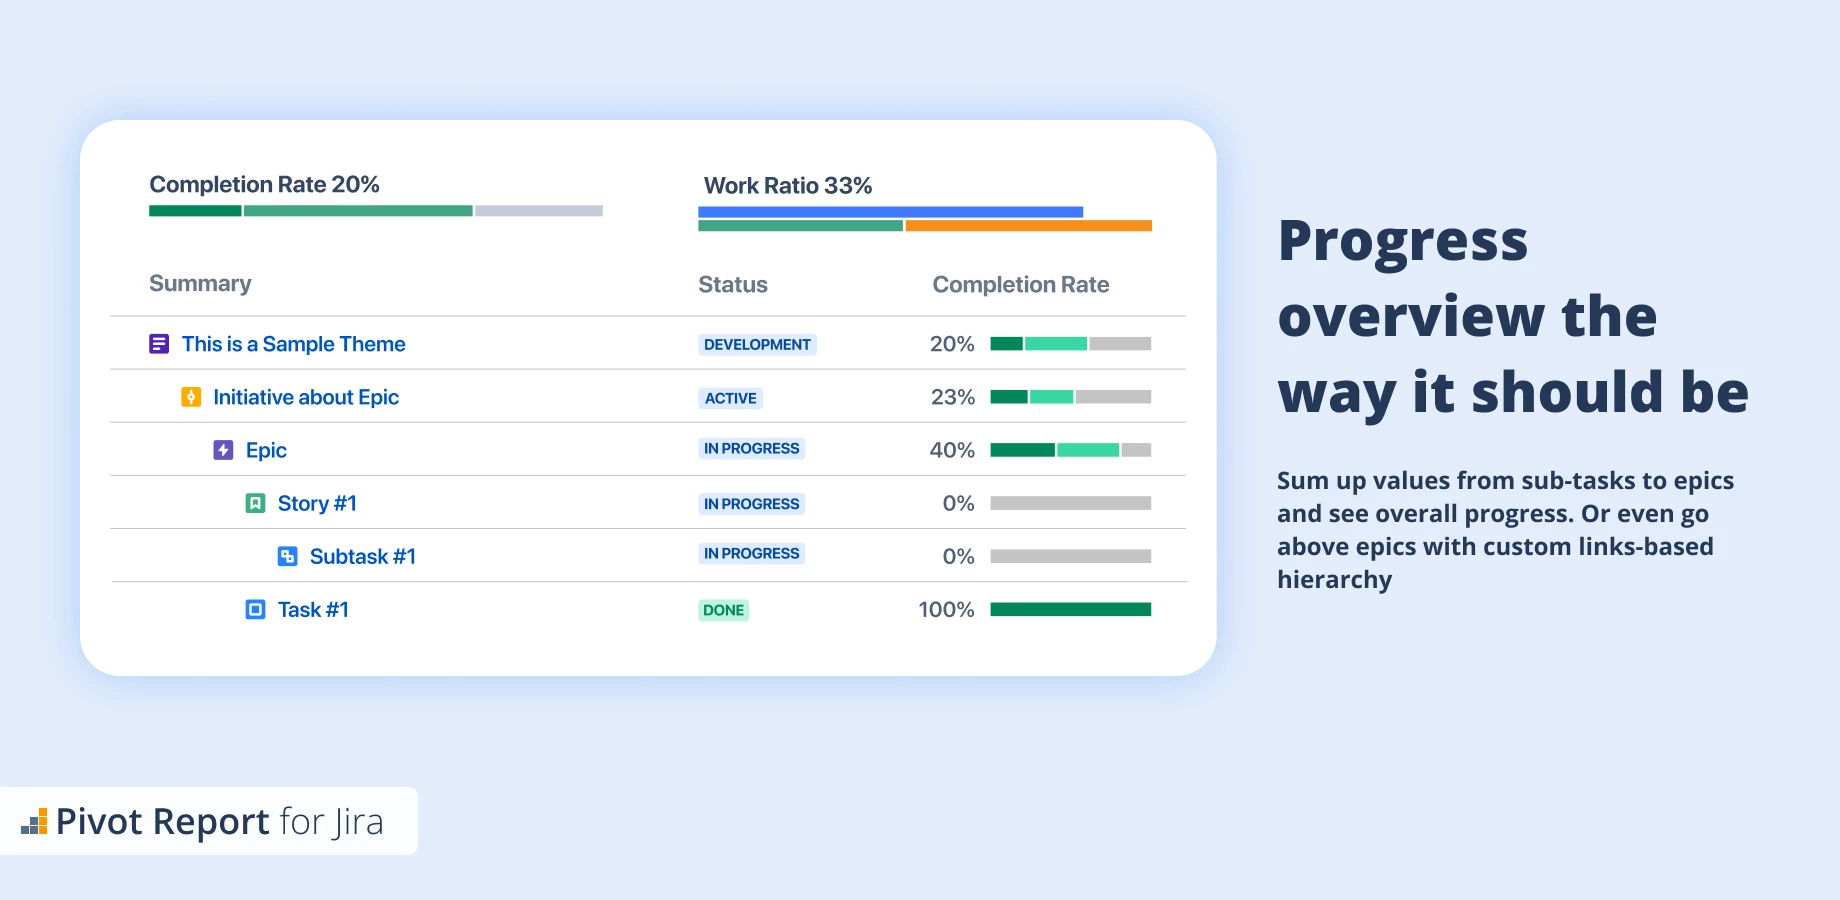
Progress overview the way it should be done
Sum up values from sub-tasks to epics to see overall progress. Or even go above epics with custom links-based hierarchy. Roll up values from number or time fields.
CUSTOM HIERARCHY PROGRESS LIVE DEMOCustomizable slices and tabs
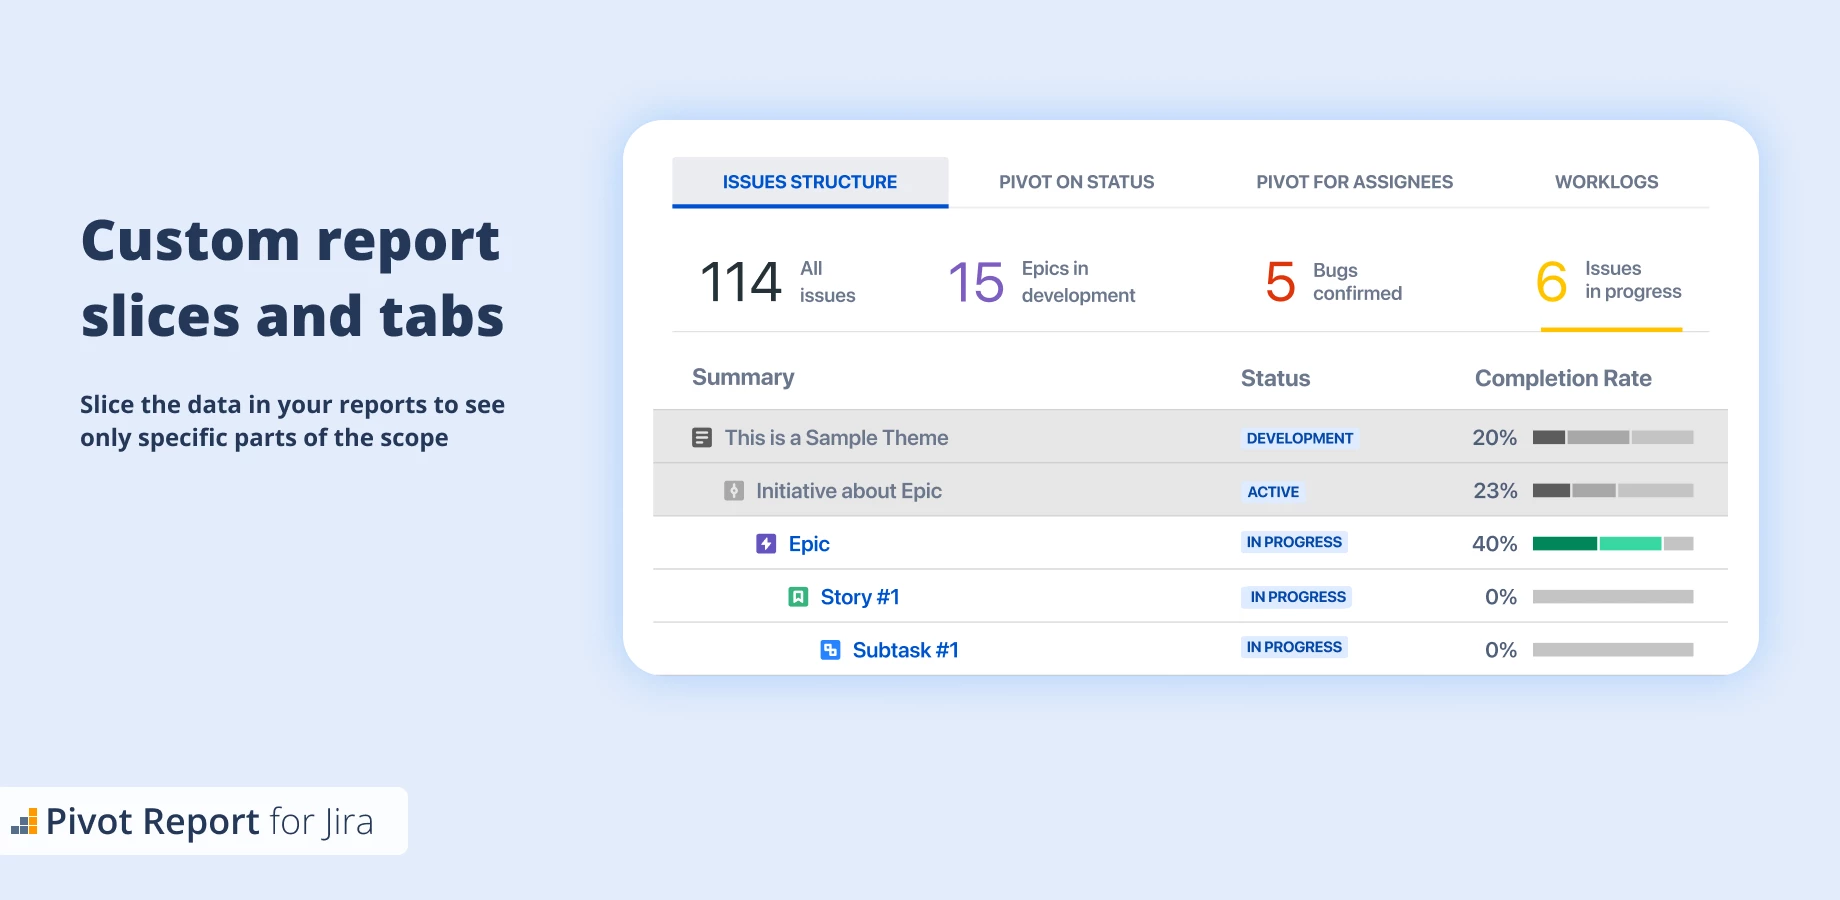
Customizable slices and tabs
Break down the big picture. Slice the data in your reports to see only specific parts of the scope. Pick the value and format to be displayed, choose the counter color and set limits.
SLICES DEMO TABS DEMOCharts of multiple types
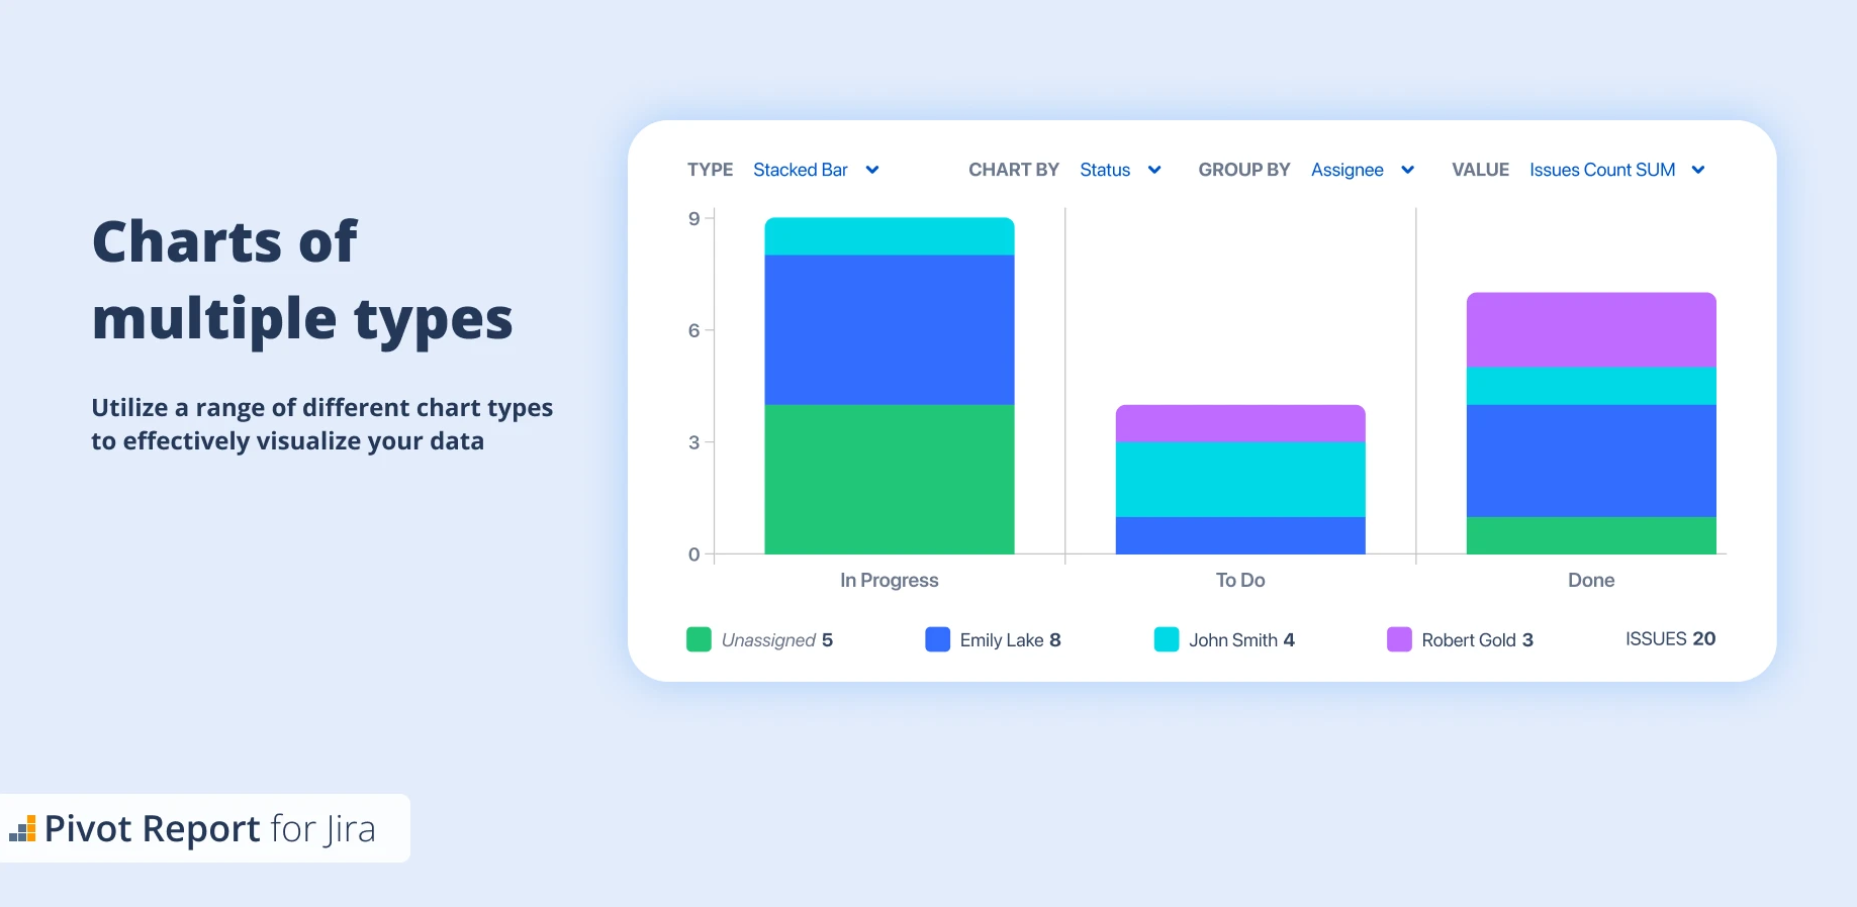
Charts of multiple types
Utilize a range of different chart types to effectively visualize your data.
CHARTS LIVE DEMOOther benefits
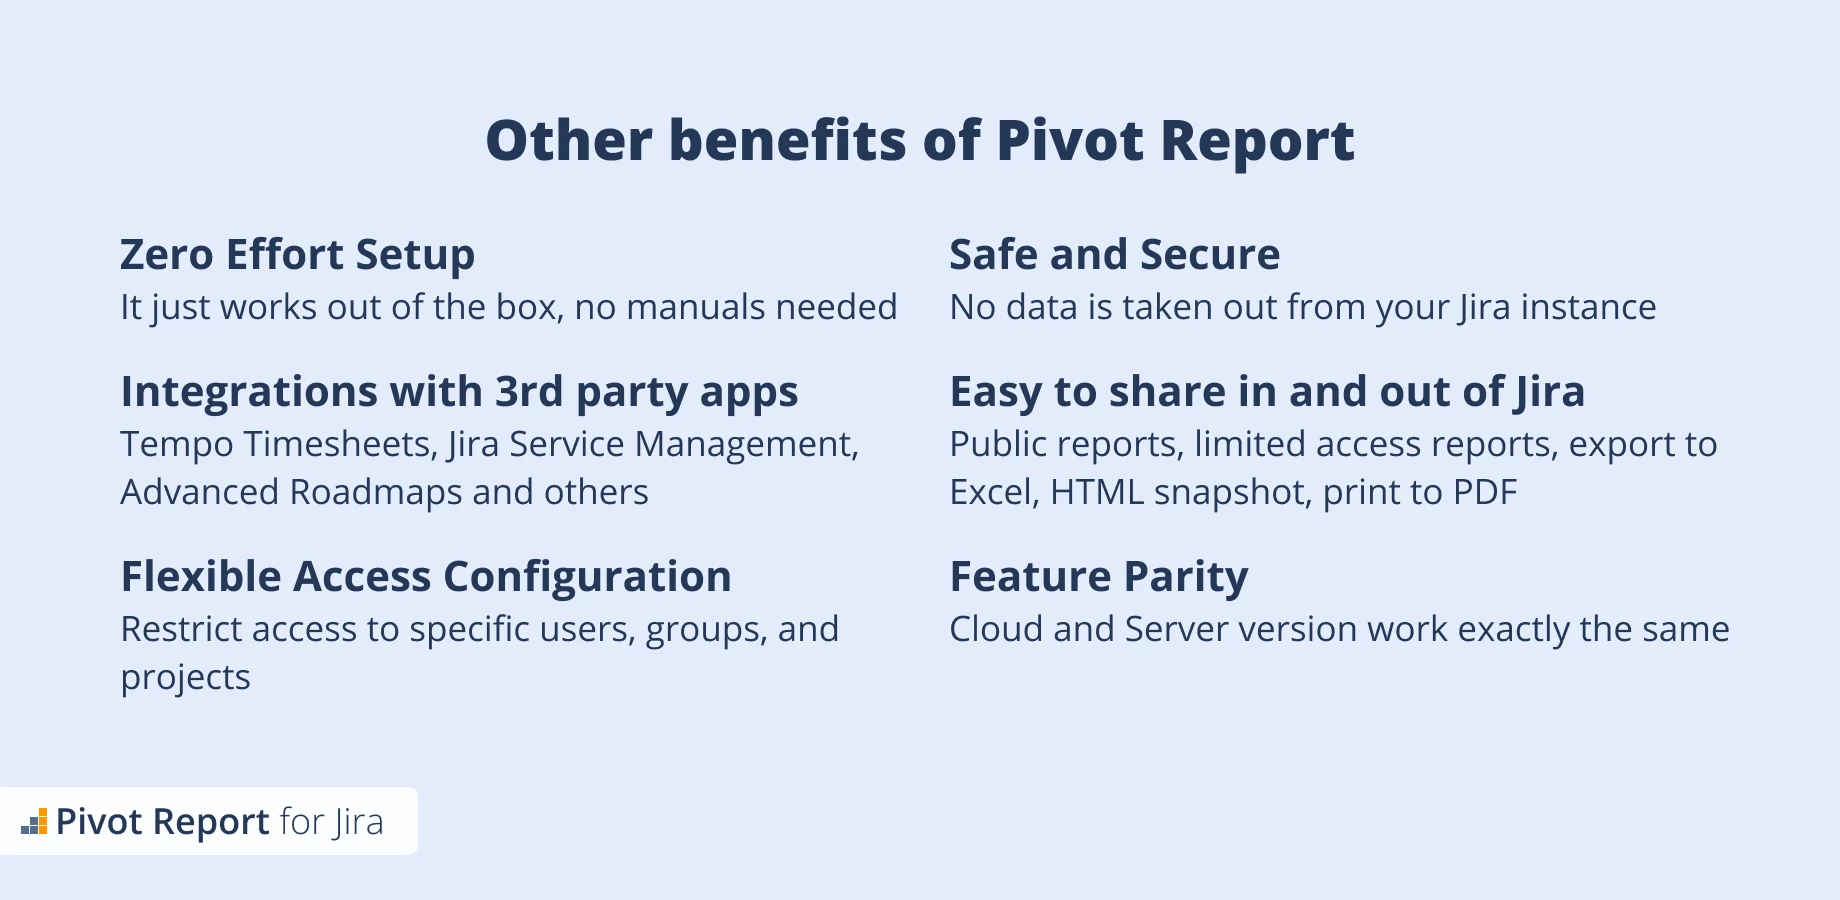
Other benefits of Pivot Report
Zero effort setup, flexible access configuration, easy to share in and out of Jira and more
Sounds too good to be true?
Check out the live demo! You are just one click away, no login required
Trusted by
Pivot Report is used worldwide in teams of all kinds
What our customers say
Check these reviews from the Atlassian Marketplace
Clear and mostly self explanatory interface, plays well with Jira in general and gives a view suitable for project management of most smaller projects.
Visibility which translate to analysis and data driven decision making.
Colined apps provide rapid macro to micro visibility into the software development lifecycle.
In particular I can view the segments and metric that interest me (story points by resource and ticket status).
More details about Pivot Report
Key features demo
Custom Hierarchy: Theme Initiative Epic
Worklogs report based on filter
Backlog report build from board with Epics
All demos can be found here
Feature party
Same features on Cloud, Data Center and Server
Easy start
Need to talk in person? Just book a meeting
Export to Excel and HTML
Any Pivot report can be exported to Excel or HTML file
That makes sharing your reports with people outside your company super easy.
Security and Reliability
Everything happens in the customer browser, so no data leaves Jira, no risk even in the cloud
Advanced permissions management
Member of Marketplace Security Bug Bounty Program
Cloud Security Program participant
Participant of Security Self-Assessment Program
Certified as Cloud Fortified App